
Balfour Beatty 2026 half year results
Strong first half performance delivering profitable growth Full year performance expected to be slightly ahead of prior guidance Philip Hoare, Balfour Beatty Group Chief Executive, said: “Balfour Beatty enters the second half with real momentum. Our strong first-half performance reflects the quality of our business, the discipline of our execution and, above all, the exceptional contribution […]

Aug 13, 2026
Strong first half performance delivering profitable growth
Full year performance expected to be slightly ahead of prior guidance
Philip Hoare, Balfour Beatty Group Chief Executive, said: “Balfour Beatty enters the second half with real momentum. Our strong first-half performance reflects the quality of our business, the discipline of our execution and, above all, the exceptional contribution of our people in delivering for our customers.
“We have continued to secure high-quality work, drive profitability and generate strong cash flow. By bringing together the best of our people, expertise and capabilities, we are supporting customers as they invest in the infrastructure which economies need to grow, now and into the future. Supported by a £23 billion order book, attractive growth markets and strong operational momentum, Balfour Beatty is well positioned to deliver these programmes safely, efficiently and at scale.
“Together, these strengths give us confidence in our outlook and in our ability to continue generating profitable growth and attractive returns for our shareholders.”
Strong first half growth driven by the earnings-based businesses
- Higher revenue due to rising demand in US Buildings and UK power transmission
- Underlying profit from operations (PFO) from earnings-based businesses increased to £153 million (2025: £108 million)
- Underlying EPS of 21.7 pence per share (2025: 14.4 pence)
Underlying profit from operations increased to £119 million
- UK Construction: 3.4% PFO margin (2025 3.6%) representing further progress excluding £10 million 2025 one-off credit
- US Construction: £22 million PFO2 (2025: £11 million loss) following strong Buildings growth and reduced Civils losses
- Support Services: £66 million PFO2 (2025: £46 million) driven by strong growth in power transmission
- Infrastructure Investments: £9 million loss2 (2025: £10 million) driven by monitor and legal costs, which have now ceased
Balance sheet and cash flow strength support sustainable and attractive shareholder returns
- Average net cash3 increased to £1,616 million (FY 2025: £1,212 million)
- Directors’ valuation of the Investments portfolio maintained at £1.1 billion
- Half year dividend increased by 12% to 4.7 pence per share (2025: 4.2p); £102 million of share buyback completed in half
Increased full year guidance following strong first half
- Low double digit percentage PFO2 growth expected from earnings-based businesses, slightly ahead of prior guidance
- Positive outlook underpinned by £22.9 billion order book (FY2025: £22.7 billion) and strength of growth markets
- Average net cash guidance increased by £200 million to a range of £1.5 - £1.7 billion
- Net finance income now expected in range of £35 - £40 million, aligned to the anticipated increased cash performance
- Implementation of “Evolve, Energise and Explore” profitable growth plan accelerating across the Group
| (£ million unless otherwise specified) | HY 2026 | HY 2025 | ||||
| Underlying2 | Total | Underlying2 | Total | |||
| Revenue1 | 5,563 | 5,563 | 5,150 | 5,150 | ||
| Profit from earnings-based businesses | 153 | 144 | 108 | 146 | ||
| Profit from operations | 119 | 109 | 77 | 114 | ||
| Pre-tax profit | 139 | 129 | 95 | 132 | ||
| Profit for the period | 105 | 97 | 73 | 101 | ||
| Basic earnings per share | 21.7p | 20.0p | 14.4p | 19.8p | ||
| Dividends per share | 4.7p | 4.2p | ||||
| HY 2026 | FY 2025 | HY 2025 | ||||
| Order book1 | £22.9bn | £22.7bn | £19.5bn | |||
| Directors' valuation of Investments portfolio | £1.1bn | £1.1bn | £1.2bn | |||
| Net cash – recourse3 | 1,708 | 1,446 | 1,237 | |||
| Average net cash – recourse3 | 1,616 | 1,212 | 1,102 | |||
| Segment analysis | HY 2026 | HY 2025 | |||||
| Revenue1 | PFO2,# | PFO margin2 | Revenue1 | PFO2,# | PFO margin2 | ||
| £m | £m | % | £m | £m | % | ||
| UK Construction | 1,569 | 54 | 3.4% | 1,563 | 56 | 3.6% | |
| US Construction | 2,475 | 22 | 0.9% | 2,087 | (11) | (0.5)% | |
| Gammon | 495 | 11 | 2.2% | 547 | 17 | 3.1% | |
| Construction Services | 4,539 | 87 | 1.9% | 4,197 | 62 | 1.5% | |
| Support Services | 727 | 66 | 9.1% | 662 | 46 | 6.9% | |
| Earnings-based businesses | 5,266 | 153 | 2.9% | 4,859 | 108 | 2.2% | |
| Infrastructure Investments | 297 | (9) | 291 | (10) | |||
| Corporate activities | (25) | (21) | |||||
| Total | 5,563 | 119 | 5,150 | 77 | |||
Sponsored Advert

Related Posts

Developer shows support for St Austell school
Cornwall’s biggest housebuilder has donated £2,000 to supporters of a special school near St Austell. The donation from Persimmon Homes to Friends of Doubletrees School in St Blazey comes from the developer’s Community Champions programme that sees £700,000 donated to...
City Centre South reaches major milestone as first tower begins to rise
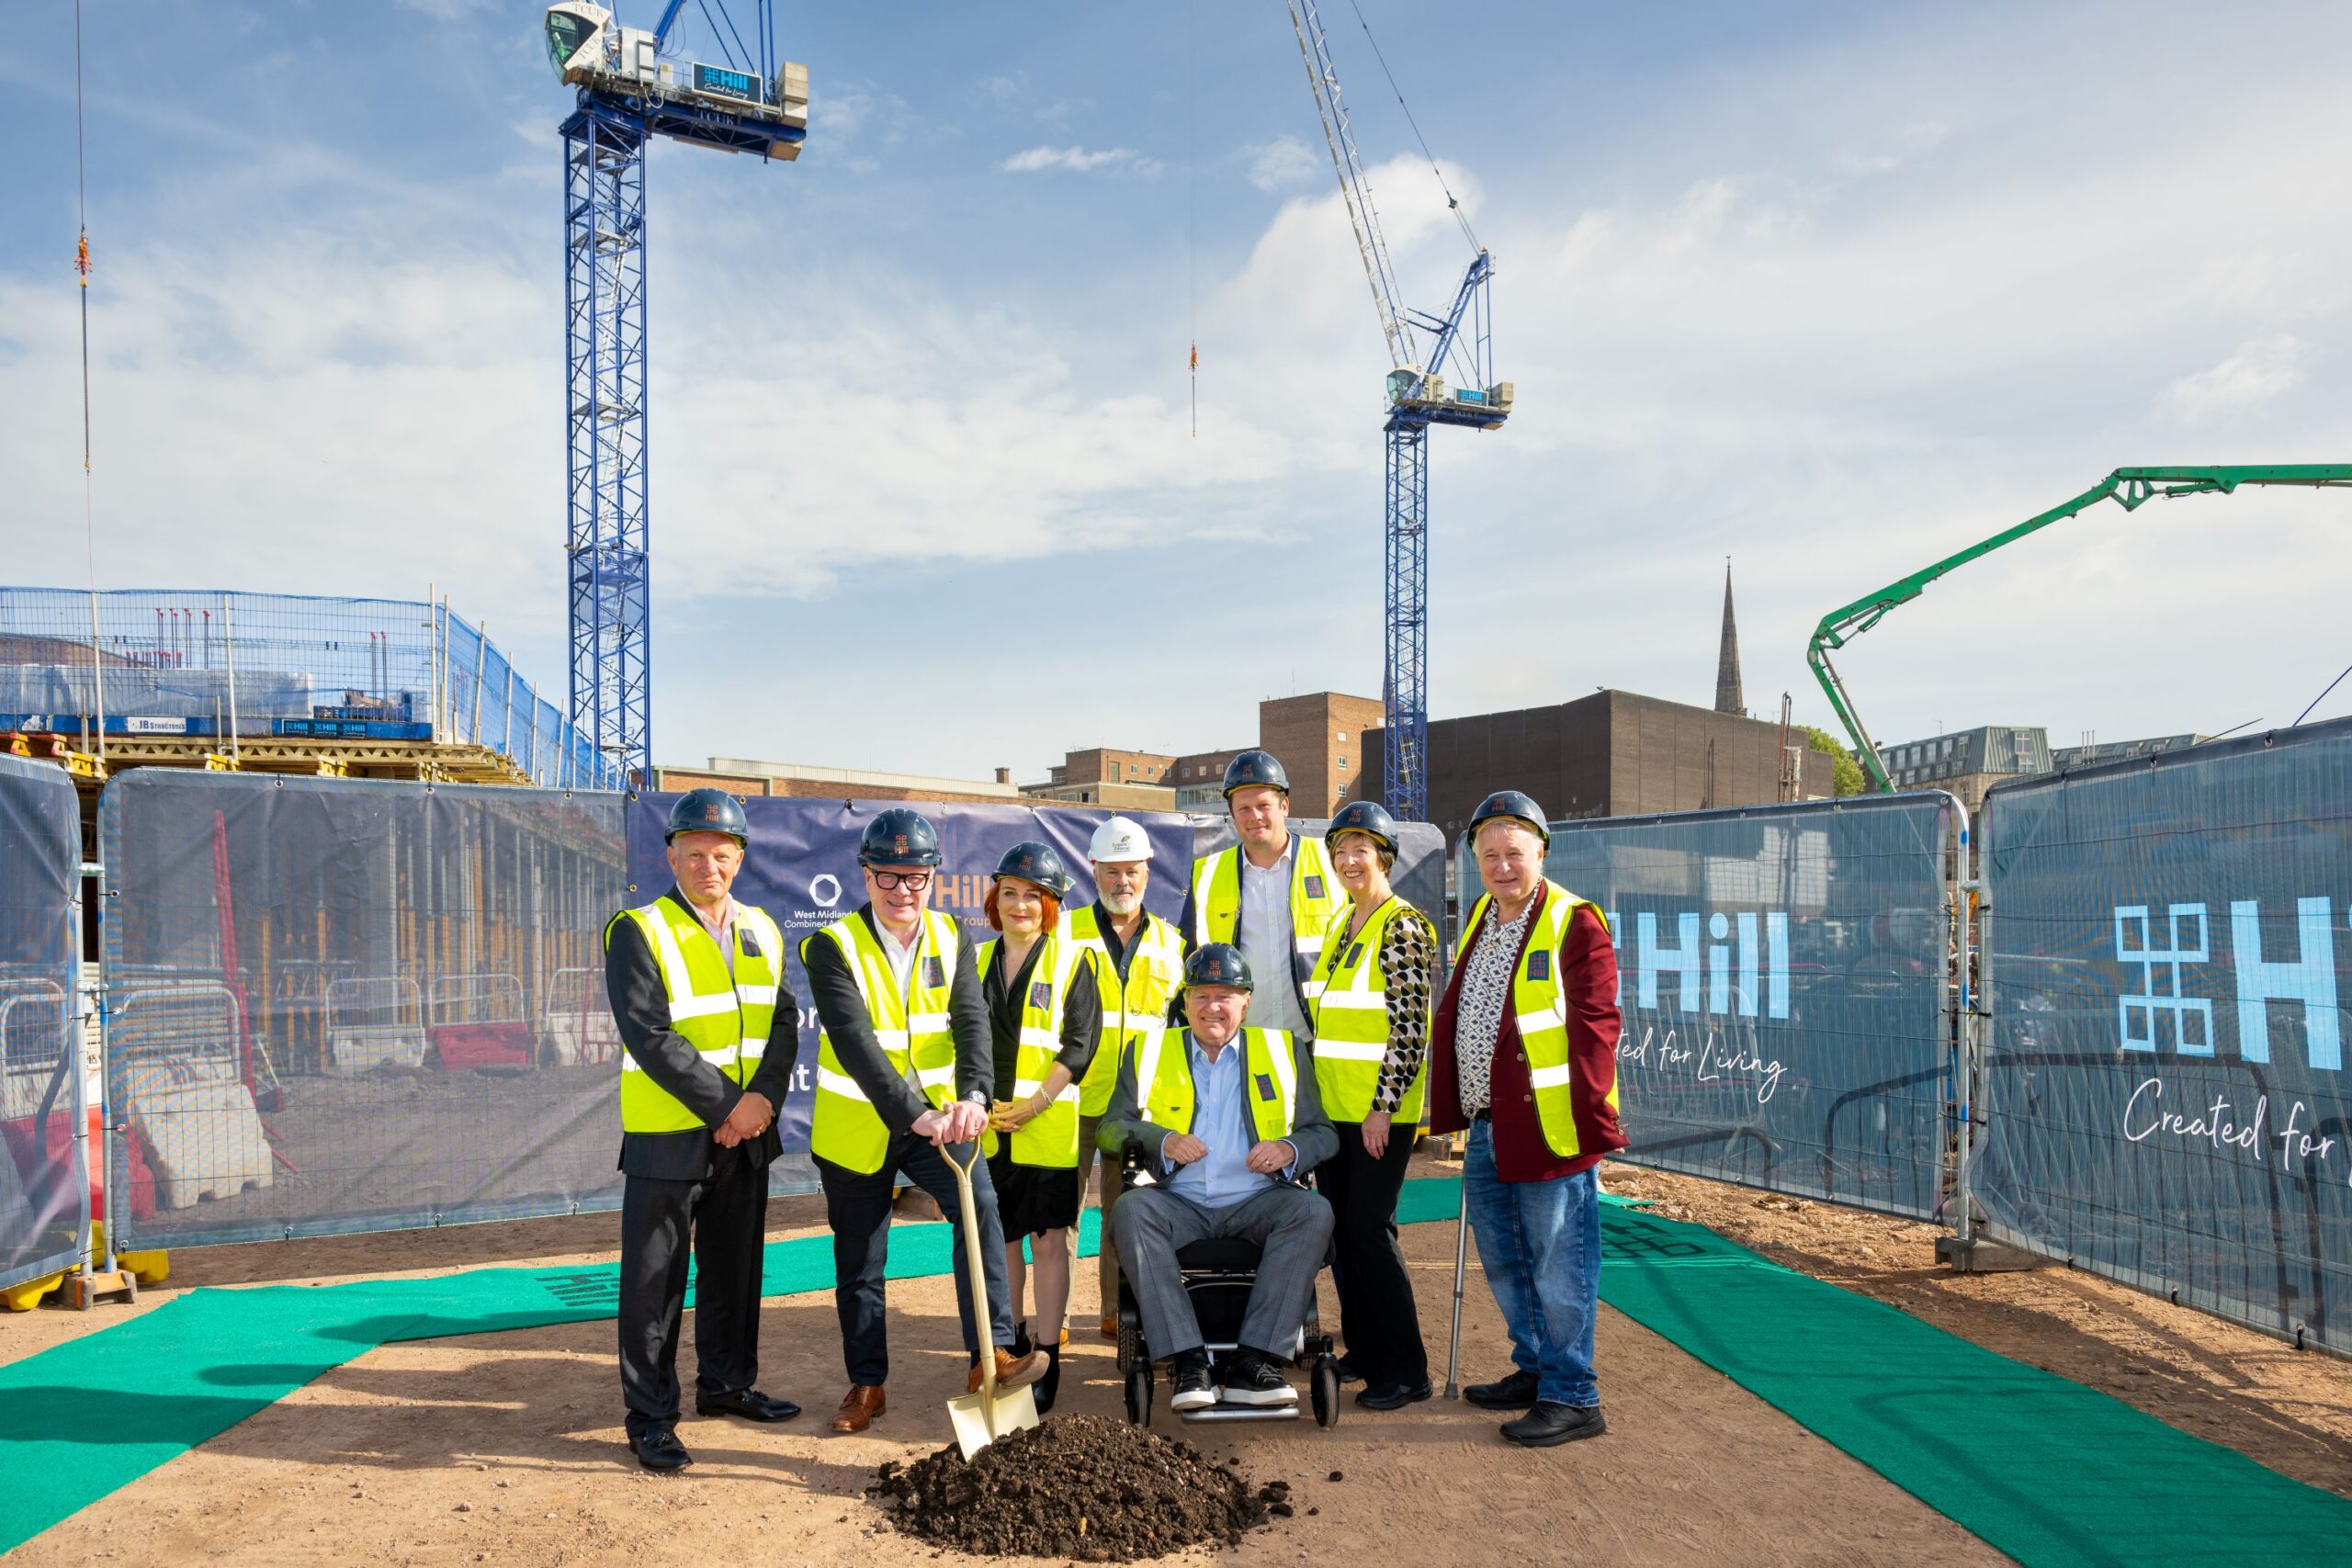
A major milestone has been reached at Coventry's transformational City Centre South regeneration project developed by The Hill Group, with the first tower now rising from the ground following the completion of demolition and extensive groundworks across the site....

New Forest District Council’s strategy puts prevention at the heart of tackling homelessness in the district
New Forest District Council (NFDC) has launched a strategy to prevent homelessness, support people at risk, and help residents find secure accommodation. The Homelessness and Rough Sleeping Strategy sets out NFDC’s priorities for tackling homelessness and...